Recently, a client sent me a business plan to review. As I always do, I turned first to the financials, and that’s where the real conversation started.
What usually surfaces in that moment isn’t a spreadsheet error. It’s a gap between what the plan claims for a return and what that return actually has to clear to be worth doing.
Rather than walk through any one client’s real numbers, this piece uses a single working example built from patterns I’ve seen across many conversations like that one, not any specific business. For this exercise, let’s call our fictitious composite business Timberline HVAC. The math is what matters here, not the name on the door.
What Borrowed Money Actually Costs
Timberline HVAC wants to add a second crew. That means a truck, tools, and a few months of payroll set aside before that crew starts paying for itself. The loan amount required is $150,000. The first number to understand is what that borrowed money actually costs.
We need to start with the Fed funds rate, which is the rate that the Federal Reserve directly controls. Banks don’t lend at that rate. By long-standing convention, banks mark it up roughly 300 basis points to arrive at what is called the prime rate. That markup isn’t arbitrary, and it isn’t new. It’s been a remarkably consistent industry benchmark for decades, and it covers the bank’s own cost of funding, the losses it absorbs across its loan portfolio when some borrowers default, and its own profit. The prime rate is where Fed funds end, and the bank’s business model begins.
From prime, the bank adds one more markup, specific to the loan itself. That markup depends on the loan type, its size, and the borrower’s file. For an SBA 7(a) loan, they might add another 250 basis points. So, the full stack looks like this: the Fed funds rate, plus roughly 300 basis points to reach prime, plus a loan-specific spread (250 basis points in this example), equals the rate quoted to the borrower.
For Timberline, start with the Fed funds rate at 3.75%. Add 3% to reach prime, 6.75%, then another 2.5% for the SBA program, for a rate of 9.25%.
That 9.25% is the break-even floor for using borrowed money. If the expansion doesn’t generate a return above 9.25%, the loan is a losing move regardless of anything else, before Timberline’s own time, effort, or risk are even factored in. That floor only holds for the life of the loan, though. Once it’s paid off, the debt service disappears. The capital stops costing Timberline anything, and what mattered as a break-even hurdle no longer applies. From that point on, the comparison that matters is the one in the next section.
It’s worth being specific about what 9.25% does and doesn’t tell you. It’s tempting to compare that number to the risk-free rate, a 3-month Treasury bill paying roughly 3%, and treat the gap, a bit over 6 points, as the market’s estimate of how much extra return an illiquid small business needs to justify its risk. That comparison is a mistake. The 9.25% is priced for the lender’s risk only, not the owner’s. The bank’s loan is secured: there’s collateral, often a personal guarantee by the owner, and in this case an SBA guarantee behind it. The bank’s downside is protected in ways an owner’s or an equity investor’s is not. So, the loan rate answers one question only: can Timberline afford the payment? It does not answer whether the expansion is actually a good use of Timberline’s risk and effort. That’s a separate, and much higher, number.
What Your Own Risk Actually Costs
To find the number that actually answers whether Timberline should undertake the effort, start with a risk-free rate that matches the length of the commitment, not the shortest one available.
A 3-month T-bill is the right reference for what you could get parking cash for a few months, zero effort, but a business investment isn’t a 3-month bet. It runs for years. The standard reference for that horizon is the 10-year Treasury, currently around 4.65%.
To that, add the long-run average premium the stock market has paid over risk-free returns. Historically, that has run roughly 4 to 6%. That brings the subtotal to somewhere around 10%, which is what a diversified investor holding ordinary, liquid public stocks can expect to earn over time.
But a small private business like Timberline isn’t a diversified portfolio of public stocks you can liquidate with a phone call or a mouse click. That gap needs two more layers stacked on top.
First, a size premium: smaller companies, even small publicly traded companies, have historically required a higher return than large ones to attract investors. Historical data on the smallest public companies puts this in the neighborhood of 3 to 4 percentage points.
Second, a private-company or illiquidity premium: there’s no stock exchange where an investor can sell their stake in Timberline tomorrow, there’s no diversification across thousands of companies, and the outcome rides on one owner, one crew, one local market. Valuation practitioners commonly add another 5 to 6 percentage points for the illiquidity premium.
Together, call it roughly 9 percentage points on top of the public-market baseline. That 9-point figure is a rough reference rather than a precise formula, but it’s enough to show where the size of that jump actually comes from.
Professional business valuators build this stack explicitly when they need to value a small private company, and for a business Timberline’s size, the total hurdle rate often lands somewhere around 19%.
That 19% is the number that actually answers the question the 9.25% loan rate couldn’t: is this worth the risk? The hurdle applies whether the $150,000 comes from Timberline’s own cash or from an outside investor, because both are based upon the same underlying decision: are you giving up a safe, liquid, diversified alternative for a concentrated bet on one business?
This is also where a common mix-up happens, and it’s worth naming it specifically. Industry benchmark data, like what you find in RMA’s Annual Statement Studies, does not produce this 19% number. That figure comes entirely from valuation and risk-premium practice, the size premium and the illiquidity premium described above. Benchmark data instead answers a completely different, and just as important, question, covered next.
Does This Industry Even Clear the Bar
Once the real hurdle is known, roughly 19% in Timberline’s case, the next question is whether the industry itself is even capable of producing that kind of return. That’s where benchmark data comes in.
I share two ways to look at industry benchmark data with my clients. A free path that contains information from public companies that is more general and a more detailed paid path that you can often access for free through your library’s reference desk or a business advisor with a subscription to tools like Vertical IQ or IBIS World.
Reading one of these tables is simpler than it looks. Three numbers matter: after-tax operating margin, how much of each sales dollar survives after taxes; sales divided by invested capital, how many times a year the capital tied up in the business turns into revenue; and return on capital, simply the first number multiplied by the second, margin times turnover.
Take pharmaceuticals as the example. Damodaran’s data puts the industry’s after-tax operating margin at 26.36% and its turnover at 1.11, meaning the capital tied up in the business turns into revenue only about 1.11 times a year, capital that’s largely locked up in research, manufacturing, and regulatory approval before a dollar of revenue shows up. Multiply the two and you get a 29.30% return on capital.
That relationship explains something that looks confusing at first glance: two businesses can land at the same investor return through completely different paths.
Broad service-type businesses run a much lower 11.10% margin, but turn their capital over nearly three times a year, 2.80, and land at a similar 31.06% return on capital. Same result, two different routes, a high margin with slow turnover, or a modest margin with fast turnover. Margin by itself says nothing about whether a return is good until you know how much capital it took to produce it.
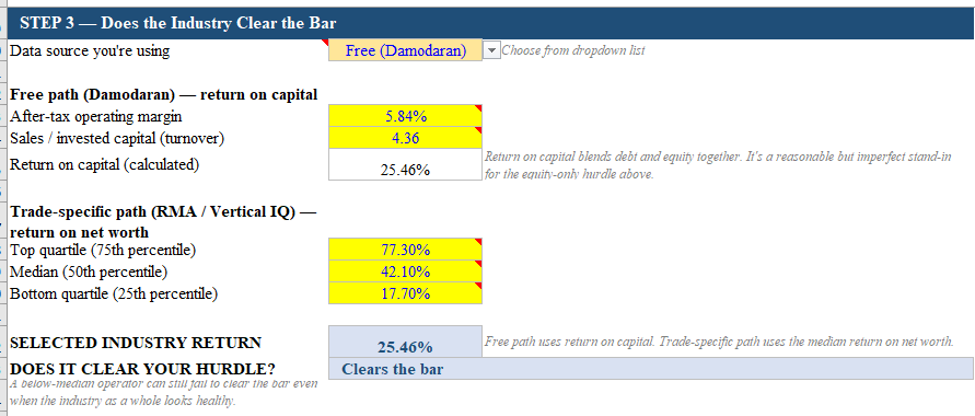
Damodaran’s public data doesn’t have a trade-specific HVAC line, so the closest proxy is Engineering/Construction, the broad bucket that includes mechanical contractors. That category shows an after-tax operating margin of 5.84%, turning its capital over 4.36 times a year, for a 25.45% return on capital, comfortably above Timberline’s 19% hurdle.
Return on capital here means the blended return on everything invested in the business, debt and equity together, which is a reasonable but imperfect stand-in, since our 19% hurdle is really testing the equity side alone.
The Trade-Specific Path: RMA or Vertical IQ
The sharper version gets that equity-specific number directly, for anyone with access to RMA’s Annual Statement Studies (now published under ProSight Financial Association, formerly the Risk Management Association) or a tool like Vertical IQ or IBIS World.
RMA breaks out HVAC and Plumbing Contractors specifically, and reports what a business earned relative to what the owner actually has invested in it, return on net worth, rather than return on total capital. That’s the more precise match for our purposes, because it isolates the equity holder’s return the same way our hurdle does, instead of blending in debt the way Damodaran’s figure does.
One thing worth clearing up before the numbers: RMA reports this figure before taxes, where Damodaran’s uses after taxes, and that’s not an inconsistency. It’s a difference in what kind of business sits behind each number. Damodaran’s data comes from public companies, which pay corporate tax before any profit reaches a shareholder, so after-tax is the honest number for them.
Most HVAC and plumbing contractors are S-corps or LLCs, which don’t pay that corporate-level tax at all. Because they’re pass-through entities, profit passes straight through to the owner. So, RMA’s before-taxes line and Damodaran’s after-tax line are actually measuring the same point in the money’s journey: what’s left after any tax the business itself owes, before the owner’s or investor’s own personal tax. The two lines are just labeled differently because the underlying entities are taxed differently.
RMA, the Risk Management Association, publishes median and quartile financial ratios across more than 600 industries, built from real financial statements submitted by banks’ own borrowers. It’s the resource I’ve relied on for 20-plus years. It isn’t necessarily the objectively “best” data source available, but it has the longest track record and the deepest industry coverage of anything comparable.
It’s also more accessible than people assume. Most public libraries carry it. The Pikes Peak Library District keeps a copy at the reference desk. Some SBDC advisors also have access to Vertical IQ, a paid alternative that covers a lot of the same ratios, though not with RMA’s full depth.
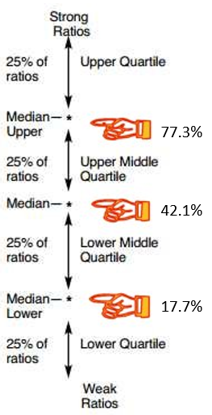
RMA doesn’t report a single average for return on net worth. Instead, it reports quartile breakpoints, the values that divide all the businesses in the study into four equal-sized groups. For the most recent year, those breakpoints are 77.3%, 42.1%, and 17.7%.
The 77.3% figure marks the threshold for the top 25% of contractors. A business above that line is outperforming three out of every four peers. The 42.1% figure is the median, the exact middle of the distribution, so half the industry sits above it and half below. Finally, 17.7% marks the threshold for the bottom 25%. A business at or below that line underperforms three out of every four peers.
Held against the same 19% hurdle, the median contractor clears it by more than double, and the top quarter clears it even further. But the bottom quarter, at or below 17.7%, falls just short.
Both versions land in the same place directionally: HVAC and plumbing is, on average, an industry capable of paying an investor what they should require.
The free data gets a reader to that answer using a blended, less precise number. The trade-specific data gets there with the right number, return on the owner’s actual stake, and shows what the broad figure hides, that a below-median operator can still fail to clear the bar. That’s exactly why this comparison matters before committing capital, not after.
Reading the Curve
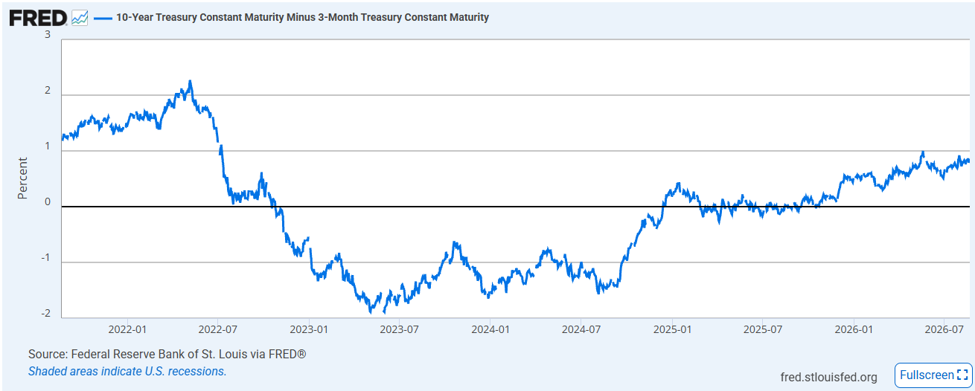
On top of both hurdles sits one more piece of context: the yield curve, specifically the gap between the 3-month and 10-year Treasury yields, tracked on FRED as T10Y3M. Normally the 10-year pays more than the 3-month, since investors want to be paid more for locking up money longer. The direction of that gap, whether it’s on the rise, holding flat, or falling, is the signal worth watching, more than any single reading on a given day.
Crossing zero, inversion, is the specific threshold that’s preceded most U.S. recessions since the 1960s. It’s also the one the Fed’s own research leans on, so it carries real historical weight. But a reader doesn’t need to wait for that crossing to pay attention to the direction of travel. One caveat worth stating clearly is that this isn’t the same as the 2-year/10-year spread more often quoted in the news, which can move on a different timeline.
None of this changes either hurdle described above. What it does do is speak to the timing of an investment. When the curve is falling or turning negative, it’s a signal that business conditions are expected to weaken. Slower growth typically means tighter spending, both from consumers and from the businesses that would otherwise become Timberline’s customers. That’s not a reason to rule out an investment, but it would be a reason to stress-test the demand it’s counting on. When the curve is rising or holding steady, it signals the opposite. Conditions are expected to hold up or improve, spending tends to loosen rather than tighten, and that adds up to a backdrop more supportive of the demand a new expansion needs. Either way, the curve doesn’t replace the hurdles from the sections above. It’s context for when to make the move, not whether the math works.
Put It Together
Put together, the whole framework comes down to four checkable steps.
If financing with debt, find the real loan rate. Fed funds, marked up to prime, marked up again for the specific loan. That’s the break-even floor, the minimum the deal has to clear just to afford the payment.
Find the real hurdle. The risk-free rate, plus the market’s average premium, plus a size and illiquidity premium for a small private business. That number answers whether the risk is worth taking, whether the capital is the owner’s own cash or an outside investor’s.
Check the industry. Pull the typical margin, turnover, and return on capital for the relevant industry from RMA, Vertical IQ, or Damodaran, and compare it to the real hurdle from step two. Does the typical business in this space even clear the bar?
Check the yield curve: is it rising, flat, or falling, and how close is it to zero? Use that to size the bet, not to decide whether to make it.
The Financials Never Lie, Again
Return to where this started: a client’s business plan, and the financials that don’t lie. The businesses that get funded, and that go on to survive, generally aren’t the ones with the best story. They’re the ones whose owner already ran this math, all four steps of it, before anyone else ever asked them to.
Want to run these numbers on your own business? I built a free worksheet that walks through all four steps: your break-even floor, your real hurdle, how your industry actually stacks up, and what the yield curve is signaling right now. Fill in the yellow cells, and it does the math for you. [Download the worksheet here.]
Do you actually know what your return has to beat, or are you just hoping it’s enough?