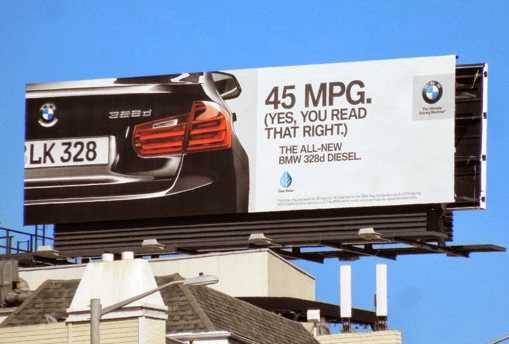
When people shop for a new vehicle, one of the first things they look at is the miles per gallon (MPG) rating. It’s right there on the sticker in big, bold letters like it’s supposed to mean something concrete. But let’s be honest—MPG is an abstract measurement that leaves most consumers doing mental gymnastics to figure out what it actually means for their wallet.
Ask yourself this: when was the last time you calculated your vehicle’s monthly or annual fuel cost in your head while walking the dealership lot? Unless you’re a spreadsheet nerd (and I salute you if you are), you probably don’t. Instead, you rely on gut instinct: “20 MPG is better than 15 MPG, so I’ll save money.” But how much money? And over how long? That’s where MPG fails us.
MPG: A Flawed Decision-Making Tool
MPG is a ratio, not a real-world cost. It doesn’t say how much money you’ll spend or save—it just hints at fuel efficiency in an indirect way. For a number that plays such a pivotal role in car-buying decisions and the total cost of ownership, it’s surprisingly unhelpful without a calculator. Consumers are left to translate MPG into dollars and cents on their own.
This is especially ironic because cars are one of the biggest household purchases people make, and the total cost of ownership—including fuel—is often a major concern. Yet instead of making this information more accessible, we continue to default to MPG, a relic from a time before data visualization and real-time pricing.
Related Post: How To Unravel The Impact Of Fragmented Knowledge On Decision-Making
A Better Way: Annual Fuel Cost
What if instead of focusing on miles per gallon, we focused on the estimated annual fuel cost based on standardized mileage assumptions and fuel prices? Most manufacturers already assume 12,000 miles per year when they design warranties, so why not use the same baseline when communicating costs?
Let’s do the math:
- Vehicle A: 15 MPG at $3/gallon driving 12,000 miles per year
= 12,000 ÷ 15 = 800 gallons × $3 = $2,400/year - Vehicle B: 20 MPG at $3/gallon
= 12,000 ÷ 20 = 600 gallons × $3 = $1,800/year
That’s a difference of $600 per year or $50 per month. Suddenly, that MPG number has a concrete impact on your budget.
For someone living paycheck to paycheck, $50 per month could be the difference between financial stress and breathing room. It’s real money—not a statistic. It’s budgeting clarity—not fuzzy math. And in sales, clarity sells.
The Business Lesson: Replace Abstract Stats with Economic Meaning
This doesn’t just apply to car buying. Businesses of all kinds fall into the trap of using vague or abstract statistics to describe benefits. I read a window company’s recent ad that said:
“Our Low-E windows reflect heat, saving you on your energy bills!”
Okay… but how much? That’s the MPG of marketing—technically true, but practically useless.
Now imagine the same ad said:
“For a typical 2,000-square-foot home, you’ll save $500 per year on your heating and cooling costs.” Now that resonates.
We see this mistake in all sorts of businesses:
- A software tool says it will “boost productivity”—but how many hours saved per week?
- A training program promises to “improve skills”—but does that mean you’ll get a raise, or close more deals?
- A consulting service claims it “helps you grow your business”—but by how much, and how fast?
The consumer or client doesn’t want to do the mental work of translating your claim into their bottom line. If they have to guess at the value, they’ll undervalue it—or worse, ignore it.
Your Challenge: Translate Features Into Dollars
Ask yourself: are you guilty of quoting MPG-like stats in your marketing or sales materials? Do you highlight features or benefits that sound good but don’t translate directly into economic impact?
Instead of saying “faster response times,” say “We save your team 4 hours per week, which adds up to 200 hours a year—worth over $6,000 in recovered productivity.”
Instead of saying “better retention,” say “Reducing turnover by 10% saves you $15,000 in rehiring and training costs.”
Your customers live in a world of budgets, not theories. Speak their language.
Wrap-Up: Concrete Over Conceptual
Whether you’re buying a car, windows, or business software, abstract statistics like MPG are less persuasive than tangible economic impact. If you want to influence behavior—especially buying behavior—talk in terms of money, time, and tangible results.
Stop hiding behind ratios and start showing real results.
What abstract statistics are you using in your business that could be turned into real, meaningful economic impact for your customers?


