What if you had a crystal ball that would let you see into the future to see if demand for your product or service was going to get stronger or weaker with time. Well, you can stop wishing. There is such a tool. It is known as Demand Curves
Understanding consumer demographics is the key to making smart business decisions, and no one, to my knowledge, does a better job than Harry Dent.
It is no surprise to anyone that every time you use a credit card, debit card, loyalty card, etc. for a purchase, the UPC code and the credit card billing address can be used to track the purchase back to you. Based upon your census information your age, gender, and other key facts can be linked to the same purchase. Harry Dent takes this large repository of data and codifies it to create what he calls “Demand Curves”.
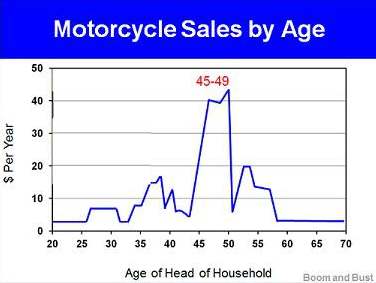
The image for this post looks at motorcycle sales based on age. As you can see, there is a huge spike in motorcycle sales between age 45 and 49.

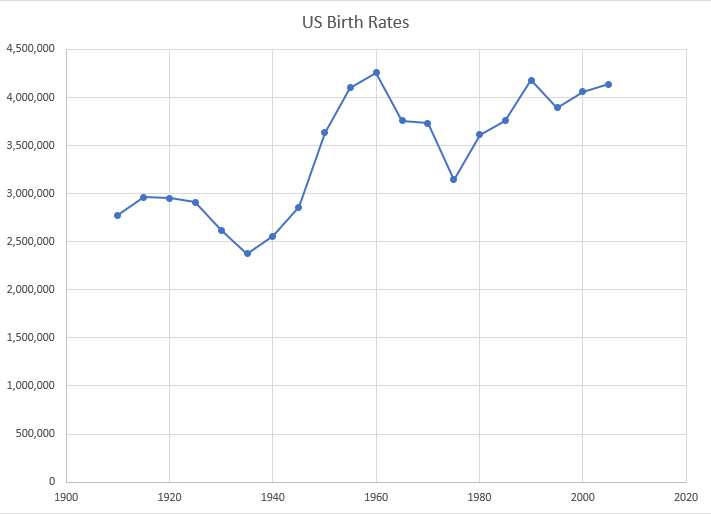
Moreover, everyone is aware that there is a baby boomer generation (born between 1946-1965) currently aging in the US. This generation represents an over 20% increase in population over the generations before and after it, and it stands to reason that as this generation passed through the ages of 45-49 it generated a motorcycle buying bubble. This explained the recent rise in motorcycle sales and the growing fortunes of the likes of Harley Davidson. However, as the baby boomers are now all past the 49 year old motorcycle buying window, it is easy to see why the fortunes of motorcycle manufactures, like Harley Davidson are in decline.
Spending waves are pretty uniformly distributed by age. However, age dispersion can be different depending on your location. For example, the median age in Boulder Colorado is 28.7 years old, compared to Boca Raton, Florida, where the median age is 45.7.
I included a copy of Harry Dent’s Demand Curves file in the Free Downloads tab of this Blog.
How can you use your knowledge of demand curves to improve your business decisions?


